Microsoft Excel 2016 Level 4.2: Analyzing Data by Using PivotTables
$5.95
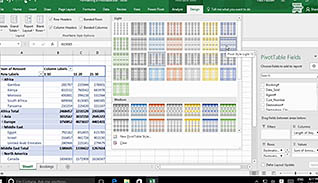
This course takes a deeper look at how to analyze data by using PivotTables in Excel 2016. You must be able to organize your data so it is easy to understand and interpret. You can also filter the data found in a PivotTable or change the format of the PivotTable itself to ensure you have provided enough functionality without cluttering the overall experience. This course shows you how to accomplish these tasks. A PivotTable is a powerful feature in Excel. It allows you to extract specific pieces of information from a larger set of data; in short, it allows you to focus on what you determine to be the important parts of that data. Utilize the information presented here and understand how to better sort, analyze, and present your data through PivotTables.
Description
Audience:
Excel 2016 users
Workplaces:
Not Specified
Topics:
Summarize PivotTable Data|Organize PivotTable Data|Filter PivotTable Data|Format a PivotTable|Refresh and Change PivotTable Data
Languages:
en
Video Format:
HD
Quiz Questions:
8
Number of Lessons:
5
Training Time:
29-37 minutes
Closed Captioning:
Yes
Devices Supported:
Windows, Apple, Android, Chrome
Required Plugins:
None
Interactive Producer:
Mastery Training Content Network
Original Content Producer:
Sonic Performance Support GmbH