Mastering Excel 365 – Basics Part 4: Charts And Tables
$5.95
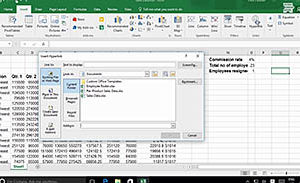
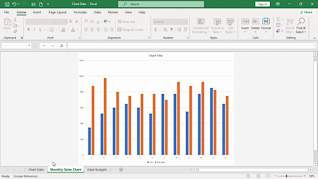
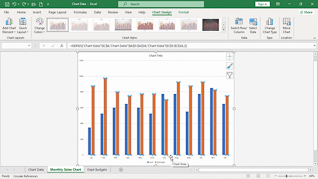
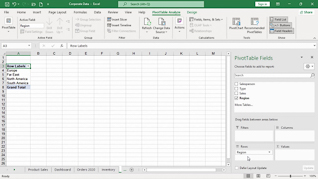
This online training course introduces Office 365 users to creating charts, tables, and PivotTables in Microsoft Excel 365. Users taking this course will learn how to organize and present data more effectively using Excel’s built-in tracking and reporting tools. Throughout the course, learners see how to create and modify different chart types to display information clearly and professionally. The training also explains how to update chart source data, customize chart elements, and format tables for improved organization and readability. In addition, employees learn how to create PivotTables to quickly summarize, analyze, and interpret larger amounts of data.
Description
Audience:
Microsoft Office 365 Users
Workplaces:
Not Specified
Topics:
Changing Chart Types|Changing Chart Source Data|Creating A Table|Creating A PivotTable
Languages:
en
Video Format:
HD
Quiz Questions:
3
Number of Lessons:
4
Training Time:
24-27 minutes
Closed Captioning:
No
Devices Supported:
Windows, Apple, Android, Chrome
Required Plugins:
None
Interactive Producer:
Mastery Training Content Network
Original Content Producer:
Bigger Brains